
Transit Method for Finding Exoplanets
Learn how the transit method finds exoplanets by measuring dips in starlight, how light curves reveal planet size and orbit, and where the method can fail.
What is the transit method?
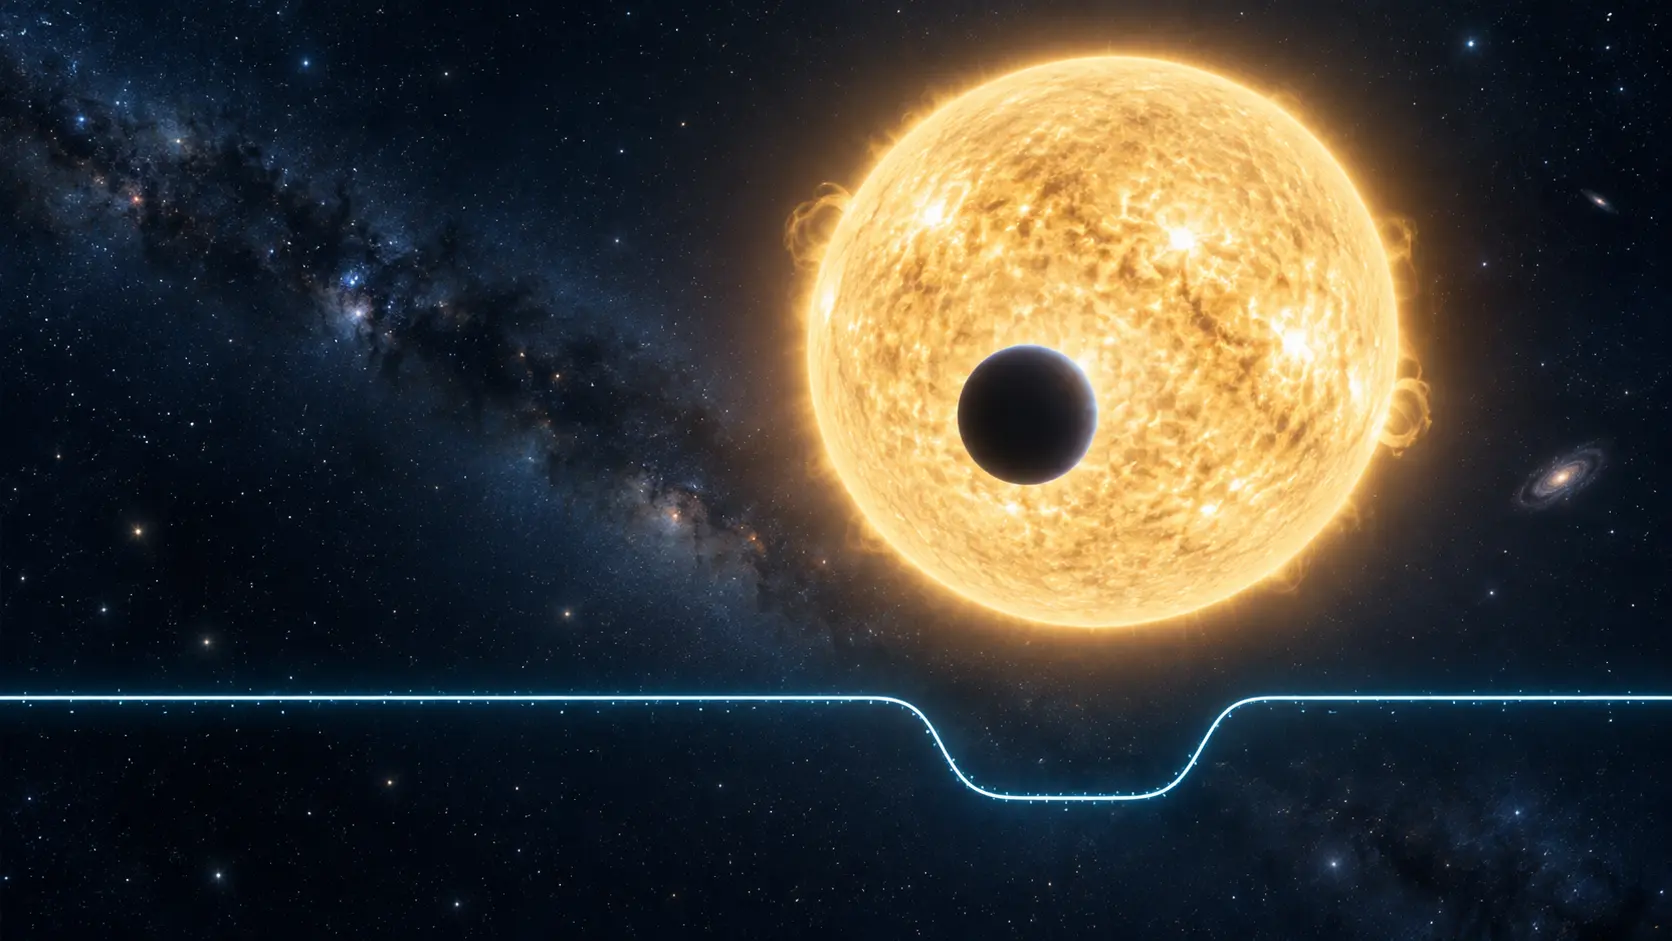
The transit method for exoplanets finds a planet by measuring the small decrease in a star's brightness when the planet passes between the star and the observer. This crossing is called a planetary transit. The planet is usually too distant and too faint to be seen as a separate object, but its silhouette blocks a tiny portion of the star's light. Sensitive telescopes record the star repeatedly and turn those brightness measurements into a graph called a light curve.
When a planet crosses the face of its star, the light curve falls and later returns to its normal level. A single dip can have several explanations, so astronomers look for a pattern. If dips of similar depth and duration repeat at regular intervals, an orbiting planet becomes a strong possibility. The time from one dip to the next gives the orbital period: the length of the planet's year.
Transit photometry has become one of the most productive ways to discover worlds beyond the Solar System. NASA's Kepler Space Telescope used it to monitor roughly 150,000 stars in one region of the sky during its original mission. NASA's Transiting Exoplanet Survey Satellite, or TESS, uses the same basic principle while surveying large portions of the sky and emphasizing relatively bright, nearby stars that are useful for follow-up study.
The method sounds simple — watch a star and wait for it to dim — but real observations require excellent instruments, careful statistics, and independent confirmation. Stars naturally change. Nearby stars can blend together. Binary stars can imitate a planet. Detectors also create noise. The scientific achievement lies in separating a genuine planetary transit from all the other events that can produce a dip.
How a planetary transit creates a light curve
A telescope records the amount of light received from a star at a sequence of times. Astronomers calibrate the measurements, remove known instrumental effects, and plot relative brightness against time. Most of the graph may appear nearly flat. During a transit, it develops a shallow valley.
The beginning of the crossing is called ingress. The planet first touches the apparent edge of the star and gradually covers more of it. Brightness declines until the entire planetary disk is in front of the star. The middle portion may look almost flat, depending on the planet's path and the quality of the data. During egress, the planet moves off the stellar disk and the measured light returns to its earlier level.
The dip is often extremely small. If a Jupiter-size planet crosses a Sun-size star, it blocks roughly one percent of the visible surface area. An Earth-size planet crossing a Sun-size star blocks only about 0.008 percent, or roughly 84 parts per million. Detecting that small signal requires stable observations and repeated measurements.
Stars are not equally bright across their disks. The center normally looks brighter than the edge, an effect called limb darkening. Therefore, a realistic transit curve is not a perfect box. Astronomers fit physical models that account for limb darkening, the planet's path, the orbit, and the exposure time. The fitted curve can reveal much more than the simple presence of an object.
What transit depth tells us about planet size
For a simple case, transit depth is approximately the square of the ratio between the planet's radius and the star's radius:
transit depth ≈ (planet radius / star radius)²
This relationship explains why large planets produce deeper transits. If the star's radius is known, the measured depth allows astronomers to estimate the planet's radius. The stellar measurement matters greatly. An incorrect star size leads directly to an incorrect planet size.
Transit observations measure radius, not mass. A world with a large radius might be a low-density gas giant, while another with a similar radius could have a much heavier interior. Astronomers often add radial-velocity measurements, which estimate mass. Combining mass and radius gives average density. Density helps researchers distinguish rocky planets, water-rich worlds, ice giants, and gas-dominated planets, although composition models can still have uncertainties.
The shape of the transit also offers clues. A central crossing takes a different path across the star than a grazing transit near the edge. The duration depends on the star's size, the planet's orbital speed, and the geometry. Multiple planets can create several repeating patterns in one light curve.
How astronomers find the orbital period
If a dip repeats every ten days, the likely orbital period is ten days. Kepler's third law connects the orbital period with the approximate size of the orbit when the star's mass is known. Astronomers can therefore estimate the planet's distance from its star, usually expressed as the semimajor axis.
Several transits are preferred because repetition helps reject random noise and one-time events. Short-period planets produce many transits during a mission and are easier to confirm. A planet like Earth crosses a Sun-like star only once per year. Observing three transits would require at least about two years from the first observed crossing, and potentially longer depending on when the mission began. This creates a discovery bias toward planets with short years.
Not every transit occurs exactly on schedule. Gravitational interactions among planets can cause transit timing variations. Small departures from a strict timetable may reveal another planet, help estimate masses, or show that the system is dynamically complex. Changes in the length of a transit can also carry information about orbital geometry.
Why alignment matters
A planet does not automatically transit from Earth's viewpoint. Its orbital plane must be aligned so that the planet crosses the apparent face of its star. If the system is tilted too far, the planet passes above or below the star in our sky and no transit appears, even though the planet is real.
The probability of a transit is higher for planets orbiting close to their stars because the star covers a larger angle from the planet's orbit. This geometric selection effect is another reason transit surveys find many hot Jupiters and other short-period worlds. Researchers correct for detection probability when using transit catalogs to estimate how common different types of planets are.
Once one planet transits, other planets in a flat system may transit too. However, planetary systems are not always perfectly level. A non-transiting neighbor can still be detected through its gravitational effect, radial velocity, astrometry, or another technique.
From detection to atmospheric science
A transit can do more than measure radius. During the crossing, a small fraction of starlight passes through the thin outer edge of the planet's atmosphere. Molecules and atoms absorb particular wavelengths, leaving subtle fingerprints in a spectrum. Comparing the star's spectrum in and out of transit can reveal atmospheric constituents. This technique is called transmission spectroscopy.
Researchers have used transit spectroscopy to study substances such as water vapor, sodium, carbon dioxide, methane, and clouds or hazes in suitable exoplanet atmospheres. A detection does not automatically mean a planet is habitable or inhabited. The same molecule can arise through different chemical and geological processes, and measurements can be affected by stellar activity and clouds.
Astronomers may also observe a secondary eclipse, when the planet passes behind the star. Just before the planet disappears, the telescope receives light from both objects. During the eclipse, it receives the star alone. Their difference can reveal thermal emission or reflected light from the planet. Tracking brightness around the whole orbit can produce a phase curve, which helps researchers study temperatures, winds, clouds, and day-night energy transport.
False positives and confirmation
An eclipsing binary star can imitate a transiting planet. If a faint binary lies near a brighter star in the same image, their combined light can create a shallow dip that resembles a planet. A small star crossing a large star can also produce a planet-like signal. Starspots, pulsations, spacecraft motion, detector behavior, and data processing can add misleading patterns.
Validation begins with repeated, consistent transits. Astronomers inspect the light curve for clues such as alternating depths, a detectable secondary eclipse, an unusually V-shaped crossing, or a shift in the apparent source position during the event. High-resolution images can reveal close neighboring stars. Spectroscopy can determine whether the host is a binary and can measure a planetary gravitational signal through radial velocity.
Some candidates become statistically validated planets when detailed analysis shows that false-positive explanations are extremely unlikely. Others receive dynamical confirmation from radial velocity or transit timing variations. The word candidate is important: it means the signal deserves further study, not that a planet has already been proved.
Advantages of the transit method
The technique can monitor many stars at once with a wide-field camera. Space telescopes avoid weather, daylight, and much of Earth's atmospheric interference, allowing extremely stable brightness measurements. Repeated surveys can build large, consistently measured planet samples.
Transits provide planet radius and orbital period directly from the light curve and stellar information. They also identify systems in an especially valuable orientation for atmospheric measurements. When combined with radial velocity, transits help yield density. In multiplanet systems, transit timing can reveal masses and hidden companions.
The method is scalable. Automated pipelines can search millions of light curves, while human review and citizen-science projects can notice unusual patterns that standard algorithms miss. As instruments and analysis improve, researchers can search for smaller signals around a wider variety of stars.
Limitations and selection effects
Geometry is the largest limitation. Most planets do not cross their stars from our viewpoint. Transit surveys also favor large planets, planets close to small stars, and short orbital periods. A small star makes an Earth-size planet block a larger fraction of the light than it would around a Sun-size star, which is why cool red dwarfs are attractive targets.
Stellar activity complicates measurements. Spots rotating across the star can create repeating changes. Bright regions and flares can alter transit depths. Unocculted spots can even distort an atmospheric spectrum. Careful analysis may require observations at multiple wavelengths and models of the star as well as the planet.
Crowded fields create blending. Long-period planets may transit only once during a survey. Weather and daylight interrupt ground-based observations. Space missions have finite lifetimes and pointing constraints. Most importantly, a light curve alone does not usually give a unique planet mass or a complete atmospheric interpretation.
These limitations do not make the method unreliable. They define which planets it finds most easily and explain why astronomers combine several methods.
Kepler, TESS, and the future of transit searches
Kepler demonstrated that planets are common and revealed systems unlike our own. Its long, steady stare was ideal for finding regular patterns and estimating planet occurrence. The later K2 mission observed fields along the ecliptic and expanded the range of stars and environments studied.
TESS surveys broad areas of the sky, often observing each sector for a shorter time than Kepler's original field. Its emphasis on bright, relatively nearby stars creates targets suited to follow-up with ground-based spectrographs and space telescopes. Some regions near the ecliptic poles receive longer coverage and allow detection of longer periods.
Future surveys will combine improved photometry, longer time baselines, better stellar measurements, and advanced statistical methods. The most valuable result is not simply a larger planet count. It is a population that helps answer how planetary systems form, how often rocky planets occur, and which nearby worlds deserve detailed atmospheric study.
Frequently asked questions
What is the transit method in simple terms?
It is a way to find an exoplanet by watching a star dim slightly when the planet crosses in front of it. Repeated dips at regular times can reveal the planet's orbit.
What does a transit light curve show?
It shows a star's measured brightness over time. A planet may create a characteristic dip with an ingress, a middle portion, and an egress.
Can the transit method measure an exoplanet's mass?
Not usually by itself. It mainly measures radius and orbital period. Radial velocity or transit timing variations can add mass information.
Why are many exoplanets not detected by transits?
Their orbits are not aligned with Earth. They pass above or below the apparent disk of their stars from our viewpoint.
Can transits reveal an atmosphere?
Yes. During a transit, some starlight filters through the atmosphere. Spectroscopy can search that light for wavelength-dependent absorption, although interpretation requires care.
Compare all exoplanet detection methods
No single technique reveals every kind of planet. Each is sensitive to a different combination of planet size, mass, distance and orbital geometry, so the full catalog is a mosaic of all of them working together.
| Method | Main signal | Best suited to | Key measurement | Main limitation |
|---|---|---|---|---|
| Transit | Repeating dip in starlight | Short-period planets aligned with Earth | Radius and period | Most orbits do not transit |
| Radial velocity | Doppler shift of stellar spectrum | Massive or close planets around bright stars | Minimum mass and orbit | Stellar activity and inclination |
| Direct imaging | Planetary light separated from star | Young giant planets on wide orbits | Spectrum, brightness, projected position | Extreme contrast |
| Microlensing | Temporary magnification anomaly | Distant and cold planets | Mass ratio and projected separation | Usually does not repeat |
| Astrometry | Position change across sky | Nearby massive planets on wider orbits | True mass and orbital orientation | Extremely small angles and long baselines |
Related exoplanet detection methods
Radial velocity
A planet's gravity tugs its star into a small, rhythmic wobble. Precise spectrographs measure the Doppler shift and reveal the planet's orbit and mass.
Direct imaging
Coronagraphs and starshades block the star's glare so a young, warm planet can be photographed as its own point of light.
Gravitational microlensing
A foreground star's gravity briefly magnifies a background star's light. A planet in the foreground system adds a short, revealing anomaly.
Astrometry
Precise position measurements reveal the tiny looped path an orbiting planet forces on its star. Gaia is beginning to unveil long-period giants this way.
Sources and further reading
- NASA Science — What's a Transit? — last verified 2026-09-17
- NASA Science — How We Find and Classify Exoplanets — last verified 2026-09-17
- NASA Exoplanet Archive — last verified 2026-09-17
- Las Cumbres Observatory — Transit Method — last verified 2026-09-17